I don't know if you have already read and discussed conclusions presented in this article, but it suggests that GAC -2012 was not a major factor in record ice retreat. I thought it may be useful to the discussion on preconditioning of ice melt and summer ice cover.
"The impact of an intense summer cyclone on 2012 Arctic sea ice retreat". Zhang et al 2013.
Showing posts with label Arctic 2012. Show all posts
Showing posts with label Arctic 2012. Show all posts
Tuesday, 23 June 2015
What role did the GAC of 2012 play in the 2012 crash?
A correspondent asks...

Wednesday, 30 January 2013
Cumulative Volume and Area: 2012.
I've been delving into the data I have on sea ice to try to a greater understanding of the changes and to be able to explain the changes in the seasonal cycles of area and volume. As part of that I've been playing around with a different way of looking at the sea ice area and volume data, running the year from the day of maximum. My aim had initially been to look at changes to the seasonal cycle without the year on year losses in volume and area, what came out of the process however needed to be dealt with before the changes in the seasonal cycle could be considered.
Wednesday, 23 January 2013
PIOMAS gridded data - 2012 is here!
The PIOMAS team have now uploaded the 2012 gridded data to their server, here. Which means more data to analyse. The only downside - it involves programming which I'm not much good at and don't enjoy at all.
Thursday, 20 September 2012
A Sea Ice Free Arctic by 2020 (and maybe sooner).
I've had this post in varying form for the last three weeks, I've dithered over posting for one reason and another, which has turned out to be for the best. That's because I can start this post with a perfect quote from Dr Julienne Stroeve.
I've been one of what has seemed at times like a minority of one in the amateur community following the loss of Arctic sea ice. My view had been that the ice was transitioning to a new pseudo-equilibrium state, one with an ice pack composed almost entirely of young ice. I now doubt that such a pseudo-equilibrium state exists, and I anticipate a rapid transition by 2020 to a virtually sea ice free state (NSIDC Extent <1M km^2), I suspect it could be much earlier than that.
The acceleration of the loss of the extent of the ice is mostly because the ice has been so thin. This would explain why it has melted so much this year. By June the ice edge had pulled back to where it normally is in September... .
..The 2007 record was set when you had weather conditions which were perfect for melting. This year we didn't have those. It was mixed. So this suggests the ice has got to a point where it's so thin it doesn't matter what the weather is, it's going to melt in the summer. This could become the new normal.Julienne Stroeve.
I've been one of what has seemed at times like a minority of one in the amateur community following the loss of Arctic sea ice. My view had been that the ice was transitioning to a new pseudo-equilibrium state, one with an ice pack composed almost entirely of young ice. I now doubt that such a pseudo-equilibrium state exists, and I anticipate a rapid transition by 2020 to a virtually sea ice free state (NSIDC Extent <1M km^2), I suspect it could be much earlier than that.
Friday, 7 September 2012
Summer Daze 2012.
Last year I posted "Summer Daze." In that post I detailed a new pattern of atmospheric behaviour centred on high pressure over Greenland, this pattern is new since 2007, and as I showed is a robust change since the 1950s in NCEP/NCAR data.
Well, it's happened again this year...
Well, it's happened again this year...
Tuesday, 4 September 2012
Er, I really can't think of title for this one.
I've had a kickself simple idea about the summer loss of thickness in calculated thickness...
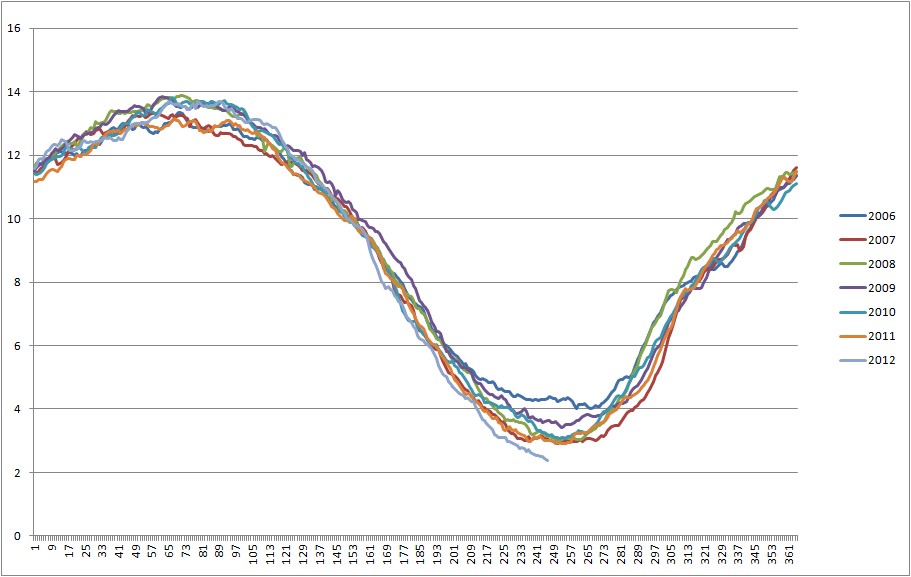
First off. A couple of weeks ago I posted "How Low Can it Go". In a nutshell I pointed out that 2007 and 2011, the previous two records, ground to a near halt in the last week of August, as the sun set on the central polar region. So I suggested that the same would happen this year.
It hasn't.

First off. A couple of weeks ago I posted "How Low Can it Go". In a nutshell I pointed out that 2007 and 2011, the previous two records, ground to a near halt in the last week of August, as the sun set on the central polar region. So I suggested that the same would happen this year.
It hasn't.
Monday, 20 August 2012
How Low Can it Go?
Two weeks ago I published a post that included some predictions about Cryosphere Today's (CT) area index, and the likely minimum. As CT area has just broken the 2011 record, it's probably time to update that post, and to examine a reason why we might not see lows as low as my naive numerical projections suggest.
Saturday, 11 August 2012
Some notes on the Early August Cyclone.
It's superfluous to say that there has been a major cyclone in the Arctic during the first week of August. I don't view this as having a pivotal role in whether we see a new record, but I do see it as having a role.

Saturday, 4 August 2012
Further Down the Rabbit Hole
Over at Neven's Sea Ice Blog, in answering a question I had cause to note that the loss of sea ice area between 27 July and the minima had decreased since 2008. Normally I'd not pay too much attention to such small periods, but as the person who'd asked the question noted - I wondered if this was evidence of a negative feedback. If I seem somewhat vague here it's because I can't recall where the conversation occured or who it was with. Anyway I went on one of those enjoyable little trips that Excel and some data can lead me on.
Friday, 3 August 2012
Three Times is Enemy Action...
Once is happenstance.
Twice is coincidence.
Three times is enemy action.
The latest PIOMAS volume figures are in, what they show is what I have expected and backs up what I'm claiming about a significant change to PIOMAS's behaviour. However despite it not being the end of the season we can still see that for 3 years in succession PIOMAS has been behaving 'oddly'.
Sunday, 29 July 2012
Here we go again...
In 2007 the Arctic lost a quarter of it's September minimum area, leading to a new record minimum, this was matched last year. Looking at the state of the Arctic sea ice at present I think we're likely to have another massive loss and soundly break 2007's record. Any earlier in the year and I'd be very sceptical of claims that ice conditions could tell us anything about the state at minima, indeed I have stated my scepticism about the long term impact of thin ice over the Barents Sea during Spring. That thinning was connected to the Pethoukhov/Semenov pattern cold Winter snap in February this year, see here. Yet the ice edge is Barents is now no different from, for example, 2011. But large scale persistent patterns of low concentration this time of year do have an impact on the coming minimum ice state.
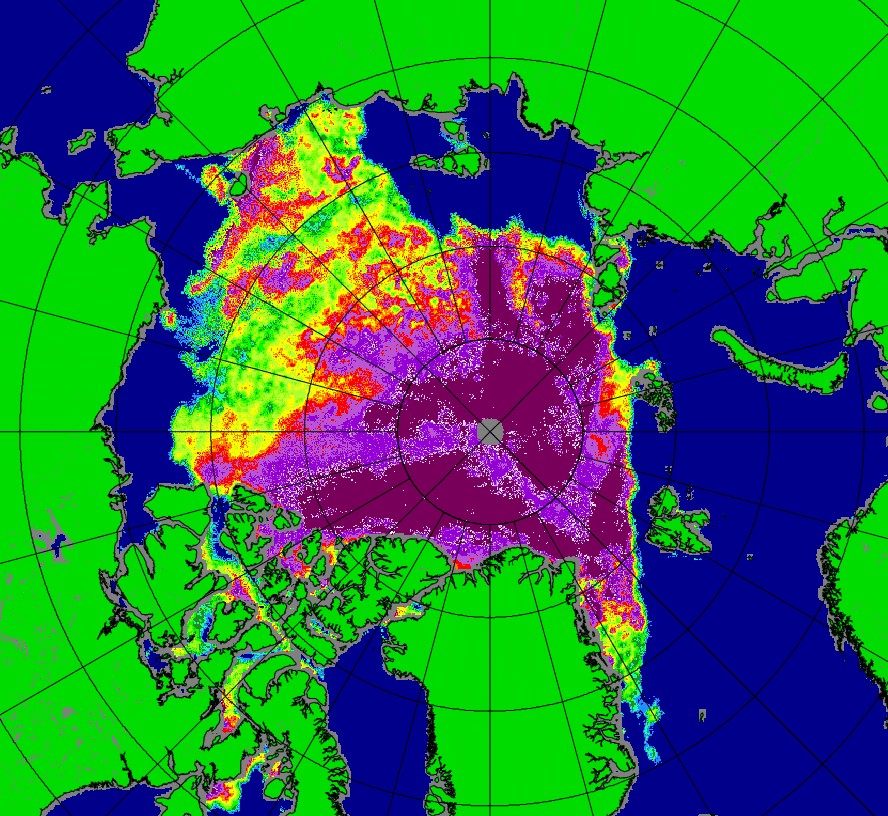
At present much of the area between Beaufort and the Siberian coast is showing very low concentrations. This image is from Bremen's SSMIS site for 27/7/12. This is not just a few days of fleeting low anomaly, it is persistent, and in my view very likely real.

At present much of the area between Beaufort and the Siberian coast is showing very low concentrations. This image is from Bremen's SSMIS site for 27/7/12. This is not just a few days of fleeting low anomaly, it is persistent, and in my view very likely real.
Saturday, 9 June 2012
A Prelude and an Intermission.
I've previously discussed a change to the annual cycle of volume loss, that being an increase in the loss of volume during the Spring, and a following loss of thickness during the Summer. Now the May 2012 PIOMAS figures are in and the early indications of May are that we face a repeat of 2010 and 2011.
The PIOMAS volume anomaly up to day 151 (31 May) is shown below. As with all the work on this blog, the baseline used to calculate the anomaly is from 1980 to 1999, a 20 year period. The PIOMAS volume series is available here.

Figure 1, PIOMAS volume anomaly.
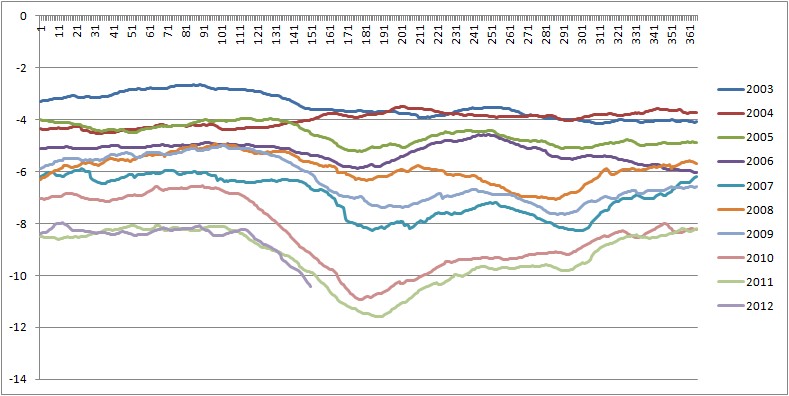
Figure 1, PIOMAS volume anomaly.
Friday, 6 April 2012
Anticipation...
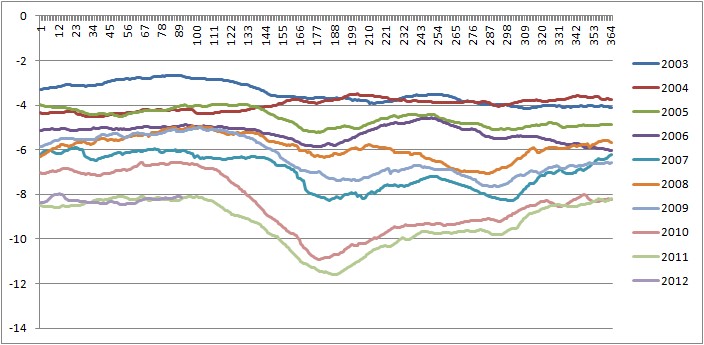
PIOMAS March volume data is now out, as anticipated the daily anomalies show nothing special with volume tracking close to last year.
The following graph is of daily volume anomalies, I've calculated the average for each day from 1980 to 1999, the value plotted on the graph is the difference from the average. Click on the graph to see the years, the general trend is down, with 2010 and 2011 showing the greatest drops, 2012 so far being the incomplete purple line.

The first indications of whether we'll see another anomalous volume drop this Spring will come early May when the PIOMAS volume data is out for April. Will see see another drop? If we do, what will that mean?
The first indications of whether we'll see another anomalous volume drop this Spring will come early May when the PIOMAS volume data is out for April. Will see see another drop? If we do, what will that mean?
Once is happenstance. Twice is coincidence. The third time it's enemy action.The anticipation is killing me...
Subscribe to:
Posts (Atom)