Saturday, 25 August 2012

PIOMAS and Cryosat, an indication.

There has been recent information that allows an indication of how well PIOMAS may be continuing to model sea ice volume. This is based an a couple of figures released from the Cryosat 2 satellite sytem and compared with the earlier, now defunct, ICESat system. The Guardian and BBC have covered this story. From the Guardian Article

In winter 2004, the volume of sea ice in the central Arctic was approximately 17,000 cubic kilometres. This winter it was 14,000, according to CryoSat. However, the summer figures provide the real shock. In 2004 there was about 13,000 cubic kilometres of sea ice in the Arctic. In 2012, there is 7,000 cubic kilometres, almost half the figure eight years ago.

Neven managed to get a clarification from Dr Laxon about these figures, here. He said "you may assume that our last data points are for ON11 and FM12. "

Immediately I discount the February/March figures, which the Guardian presumably state as winter, I do this because the PIOMAS domain is much larger than the Cryosat 2 area, so winter figures are not comparable. With regards the October/November figures, as far as I can tell the two systems cover almost the same area of ice at these periods, the peripheral ice outside the Cryosat 2 domain, but within PIOMAS's, is thin this early in the freeze season, so should not add much error due to peripheral seas PIOMAS covers but PIOMAS does not.

So what is the agreement between the two systems? I've calculated the PIOMAS average for the whole of October and November of 2004 and 2011, although the ICESat data window is smaller than this, the Cryosat period is unknown, so it seemed like the most conservative way to compare.

     ON 04       ON 11  
PIOMAS 12.280 6.851
Cryosat 2 13.000 7.000

The results are close, it surprised me how close. This can only be taken as indicative, despite the close agreement just two data points are not enough to be satisfyingly sure. Furthermore Dr Laxon has cautioned about the figures for Cryosat 2 being preliminary. However what if we take this evidence as one part of a larger picture.

PIOMAS is well validated against the Submarine thickness data in the Data Release Area, also against ICESat, on which the ON04 figures released by the Crosat 2 team are based. The question remains - Is the recent volume loss an artefact of the PIOMAS model, or is it real?

The denialists try to keep people's attention on single facts, and away from the overall picture, the last thing they want is to have to ackonowledge the volume loss and its implications. The overall picture is that not only does PIOMAS show massive and accelerating volume loss, but so does the US Navy's (pdf). What matters here is that the free running climate models are underestimating change in terms of extent/area, while the assimilating models, PIOMAS and the NPS model, are showing substantial volume loss. PIOMAS is validated against past data and agrees well (Schweiger et al 2011), now we have PIOMAS agreeing well with a peek view of the Cryosat data. ICEsat showed that the volume loss is due to multi-year ice loss (Kwok et al 2008), so does PIOMAS. Furthermore we have three new records for sea ice area in five years, is it significant that two of those records have been in the last two years? Is it a coincidence that these latest records have been in years without weather particularly conducive to ice melt, after PIOMAS has shown, in 2010, the near annihilation of multi-year ice? To claim that all this evidence (and more I'll discuss later) is pointing in the same direction by accident is, to put it bluntly, a load of bollocks.

Kwok et al, 2008, Thinning and volume loss of the Arctic Ocean sea ice cover: 2003–2008.
http://rkwok.jpl.nasa.gov/publications/Kwok.2009.JGR.pdf

Schweiger et al, 2011, Uncertainty in modelled sea ice volume.
http://rkwok.jpl.nasa.gov/publications/Schweiger.2011.JGR.pdf
Monday, 20 August 2012

How Low Can it Go?

Two weeks ago I published a post that included some predictions about Cryosphere Today's (CT) area index, and the likely minimum. As CT area has just broken the 2011 record, it's probably time to update that post, and to examine a reason why we might not see lows as low as my naive numerical projections suggest.

Sunday, 12 August 2012

Drought again...

Due to events in the Arctic this will be a short post, no need to click 'more', there isn't any more.

Stuart Staniford, on his "Early Warning" blog, has done a typically excellent post on Aiguo Dai's latest paper, the post is here. I've previously blogged on the issue of drought and Hansen's Climate Dice, here and here. Dai's paper is published around the same time as Hansen's Climate Dice new paper is also published, that's discussed here, the actual paper is available here. It's basically a re-run of the Climate Dice whitepaper Hansen released last November, this time peer reviewed and published.

Aiguo Dai's paper, "Increasing Drought under Global Warming in Observations and Models" is available here, that link brings up an html version of the paper for me - no paywall. It revisits earlier work and finds that the lack of drought signature in the US had been due to climatic variability, specifically the Pacific Interdecadal Oscillation, as that impact is now reducing and the warming is continuing, the match between models and observations this century has improved. But rather than me re-produce Stuart's post go read it.

Actually, it strikes me that Al Qaeda have been following the wrong path all along. Instead of suicide bombings, the way to destroy the USA would be to set up an Islamic theocracy somewhere where there's loads of oil, get the US addicted to it by selling it for less than it's really worth, and let the climate system do the hard work. Hang on...

Saturday, 11 August 2012

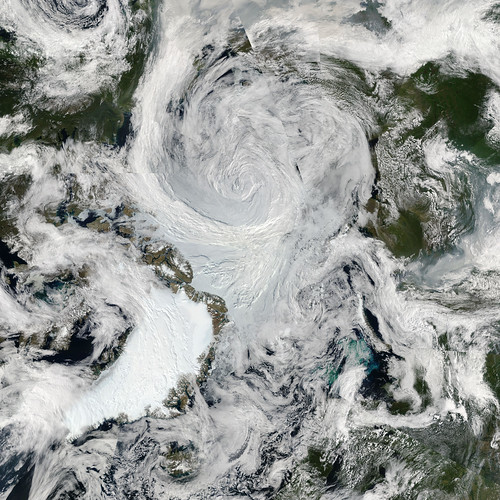
Some notes on the Early August Cyclone.

It's superfluous to say that there has been a major cyclone in the Arctic during the first week of August. I don't view this as having a pivotal role in whether we see a new record, but I do see it as having a role.

Summer Storm Spins Over Arctic

Saturday, 4 August 2012

Further Down the Rabbit Hole

Over at Neven's Sea Ice Blog, in answering a question I had cause to note that the loss of sea ice area between 27 July and the minima had decreased since 2008. Normally I'd not pay too much attention to such small periods, but as the person who'd asked the question noted - I wondered if this was evidence of a negative feedback. If I seem somewhat vague here it's because I can't recall where the conversation occured or who it was with. Anyway I went on one of those enjoyable little trips that Excel and some data can lead me on.

Friday, 3 August 2012

Three Times is Enemy Action...


Once is happenstance.
Twice is coincidence.
Three times is enemy action.

The latest PIOMAS volume figures are in, what they show is what I have expected and backs up what I'm claiming about a significant change to PIOMAS's behaviour. However despite it not being the end of the season we can still see that for 3 years in succession PIOMAS has been behaving 'oddly'.